
Real-time Blob Analytics
Interactive dashboards that show blob usage, costs, and market signals — designed to help teams make data-driven decisions quickly.
Key items on this page:
- Live Feed — recent blocks and blobs
- Total Blobs chart — volume over time
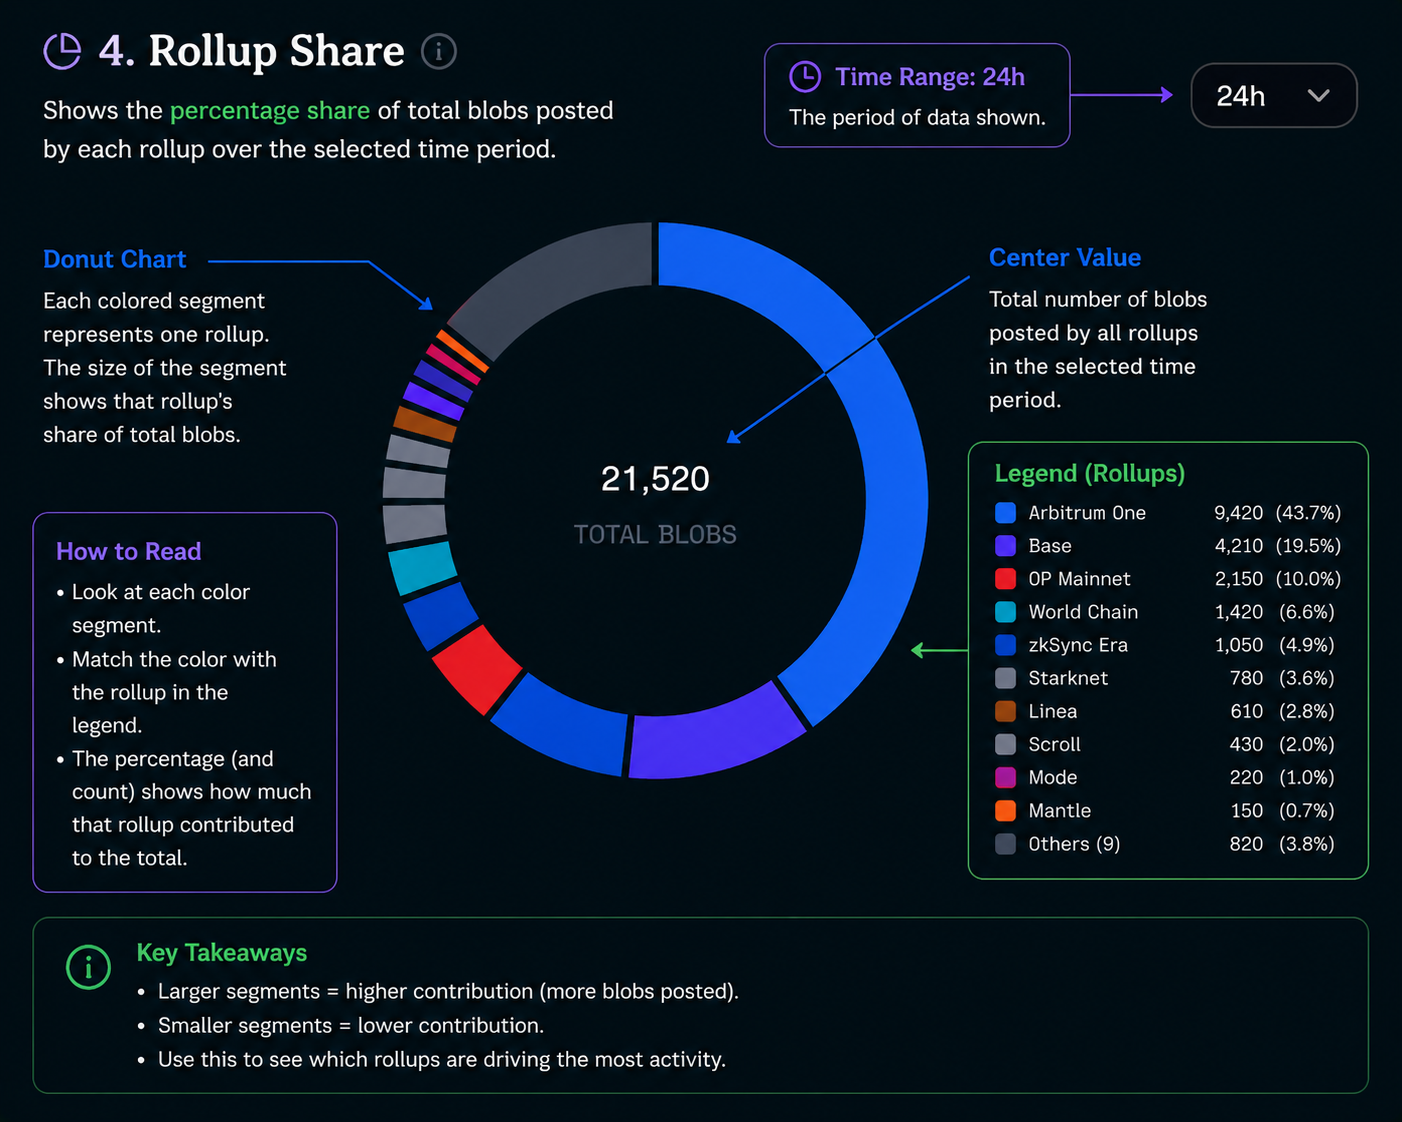
- Rollup Share donut — who is producing blobs
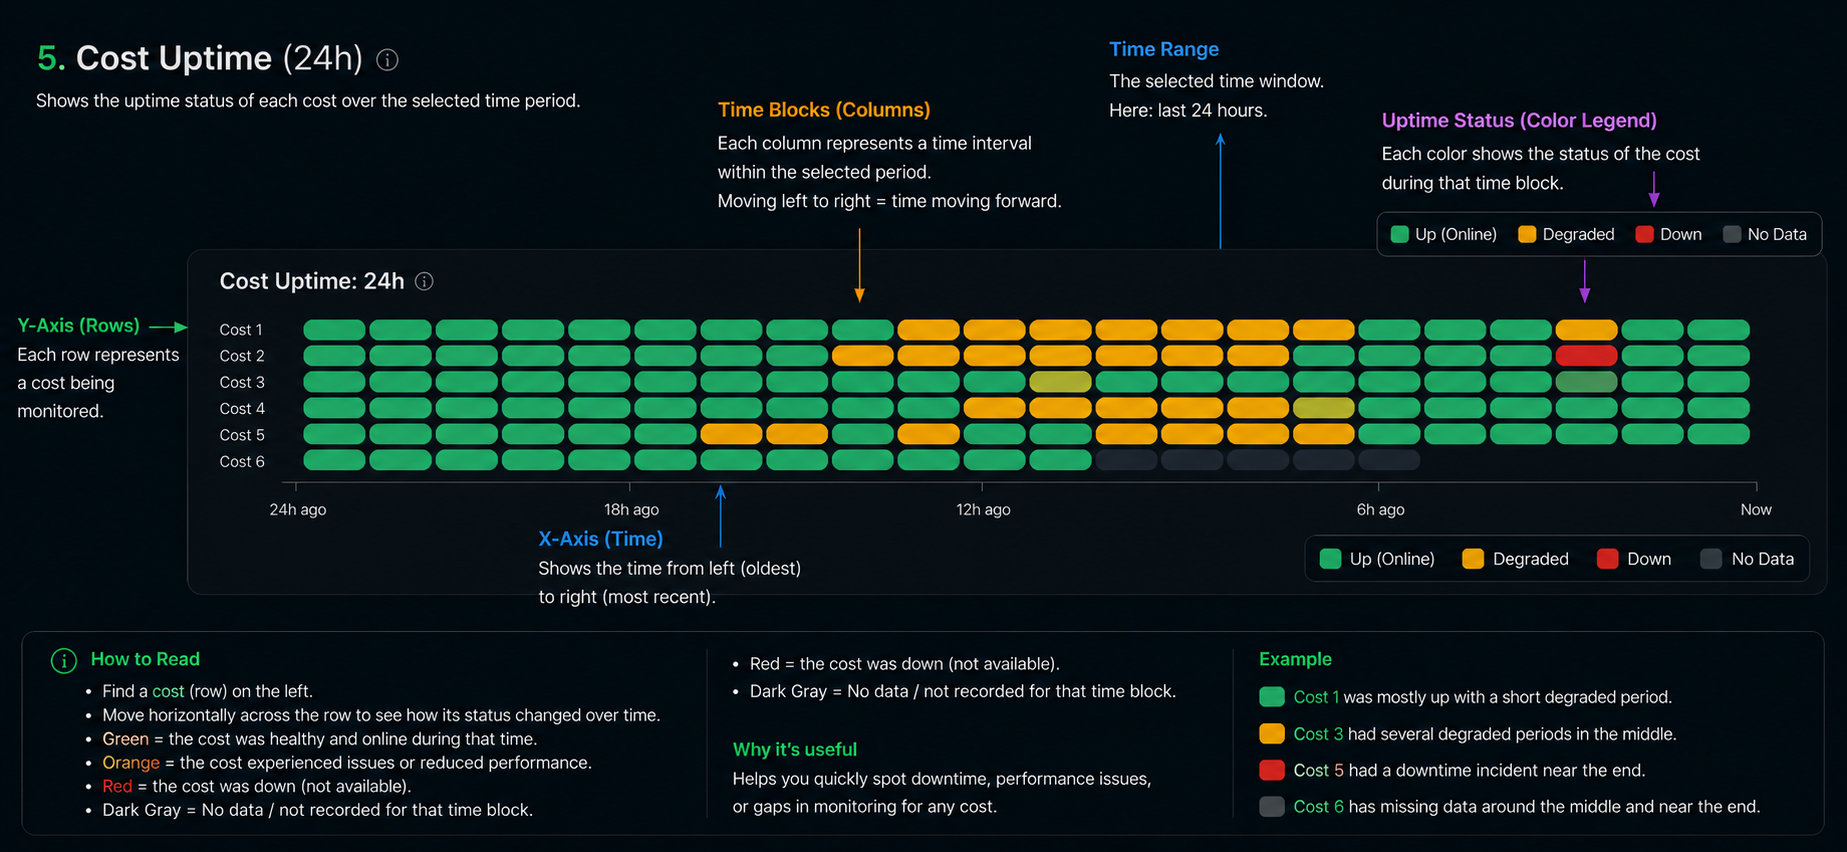
- Cost Heatmap — cost per blob over hours and days
Real-time Data
Access live blob transaction data, costs, and network metrics updated continuously.
Deep Analytics
Understand blob trends, market dynamics, and cost optimization strategies.
API & Integration
Integrate blob analytics into your applications with our comprehensive API.
Historical Blob Cost
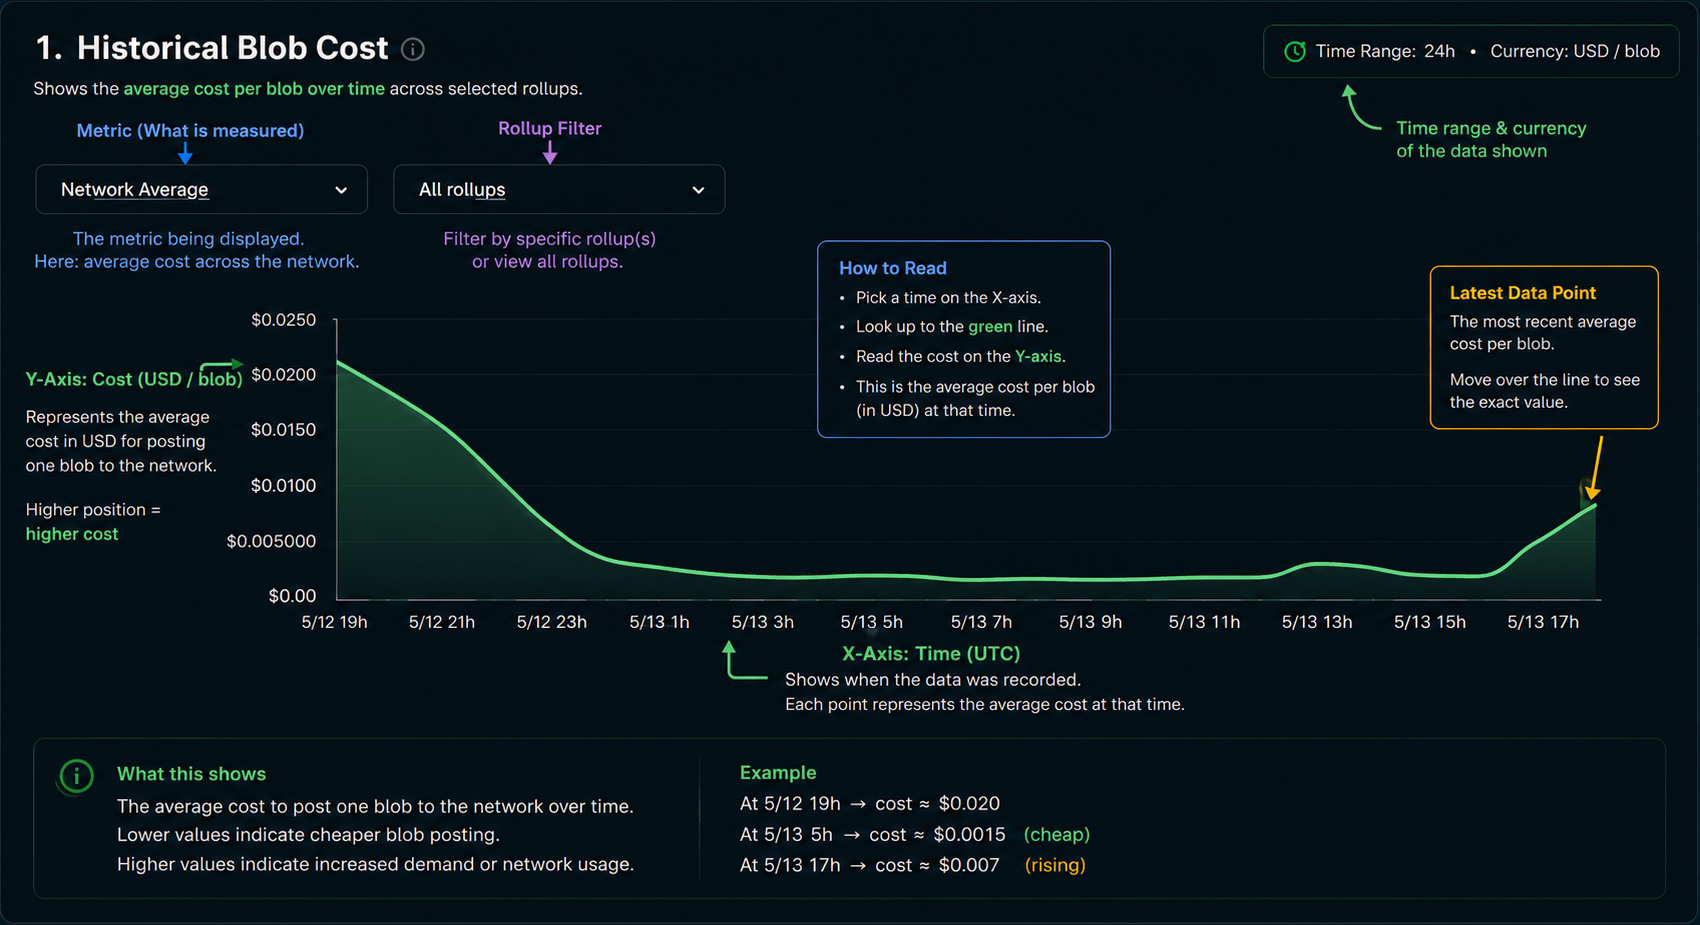
Shows cost per blob throughout the past 24 hours. Use this to identify peak fee periods and cost trends.
Current Transaction Cost
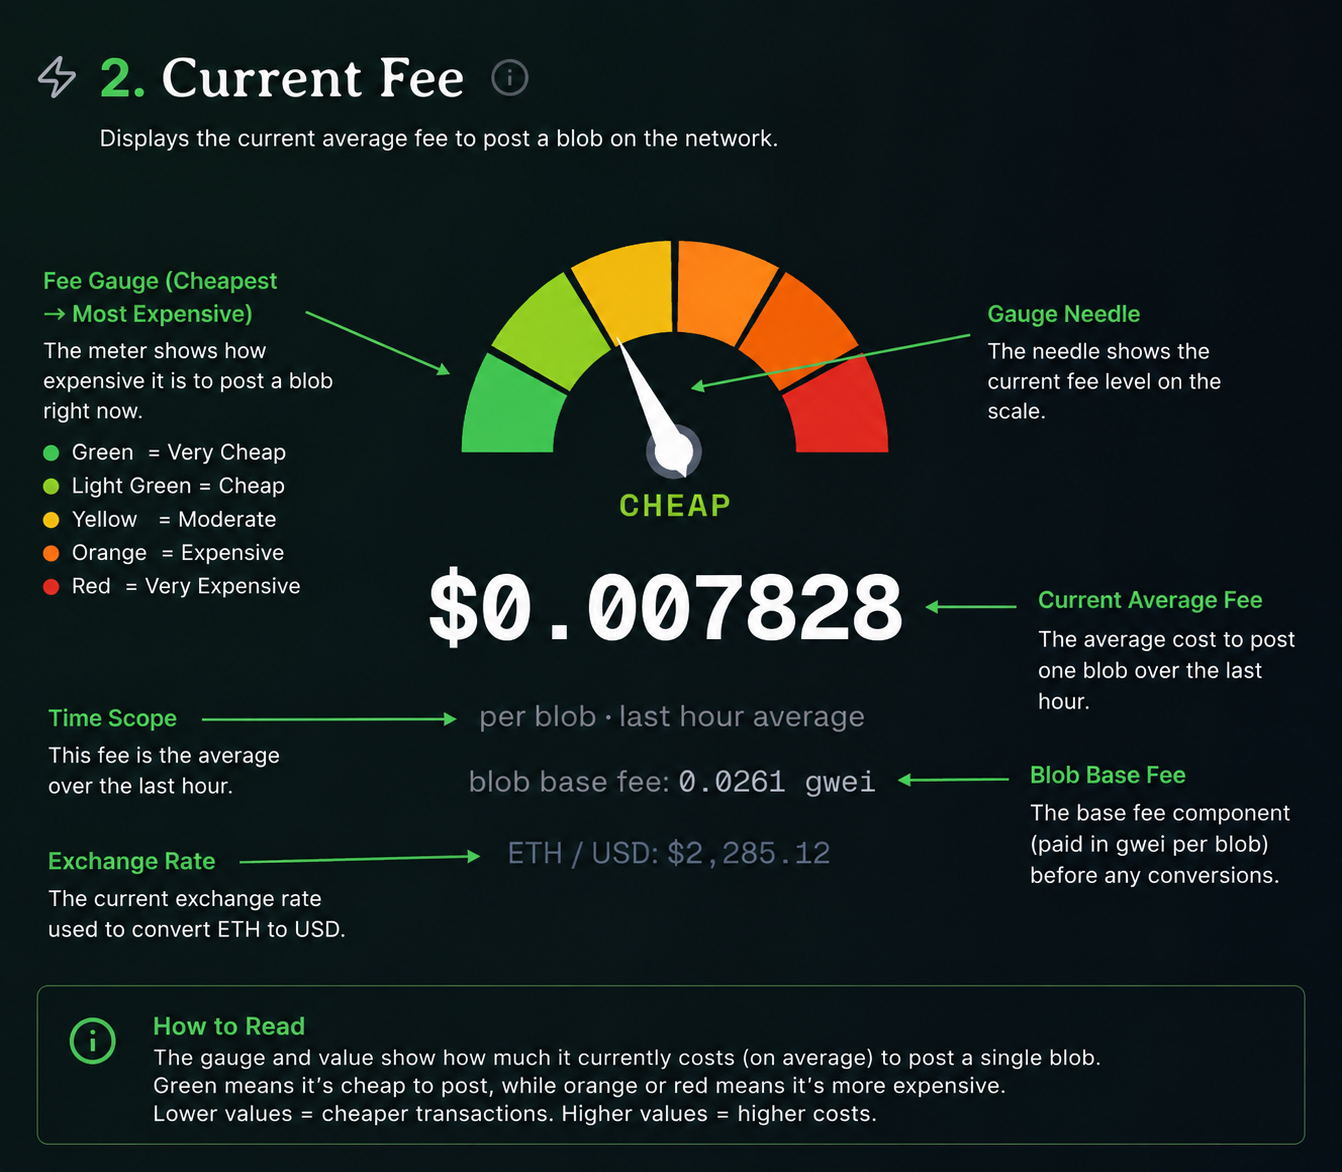
Real-time gauge showing whether blob costs are currently cheap, normal, or expensive based on recent activity.
What is a Blob?
A "blob" is a compact chunk of transaction data used by modern Ethereum rollups to store user data more efficiently. Think of blobs as packets of data attached to transactions — they let applications include larger payloads at lower on-chain cost. Blobs are most useful for batching many small pieces of data, storing off-chain references, or shipping larger application data without bloating the main chain.
In simple terms: blobs let developers move more data while keeping fees lower. This overview will help you read the live feed, understand key metrics, and use the dashboard to make decisions.
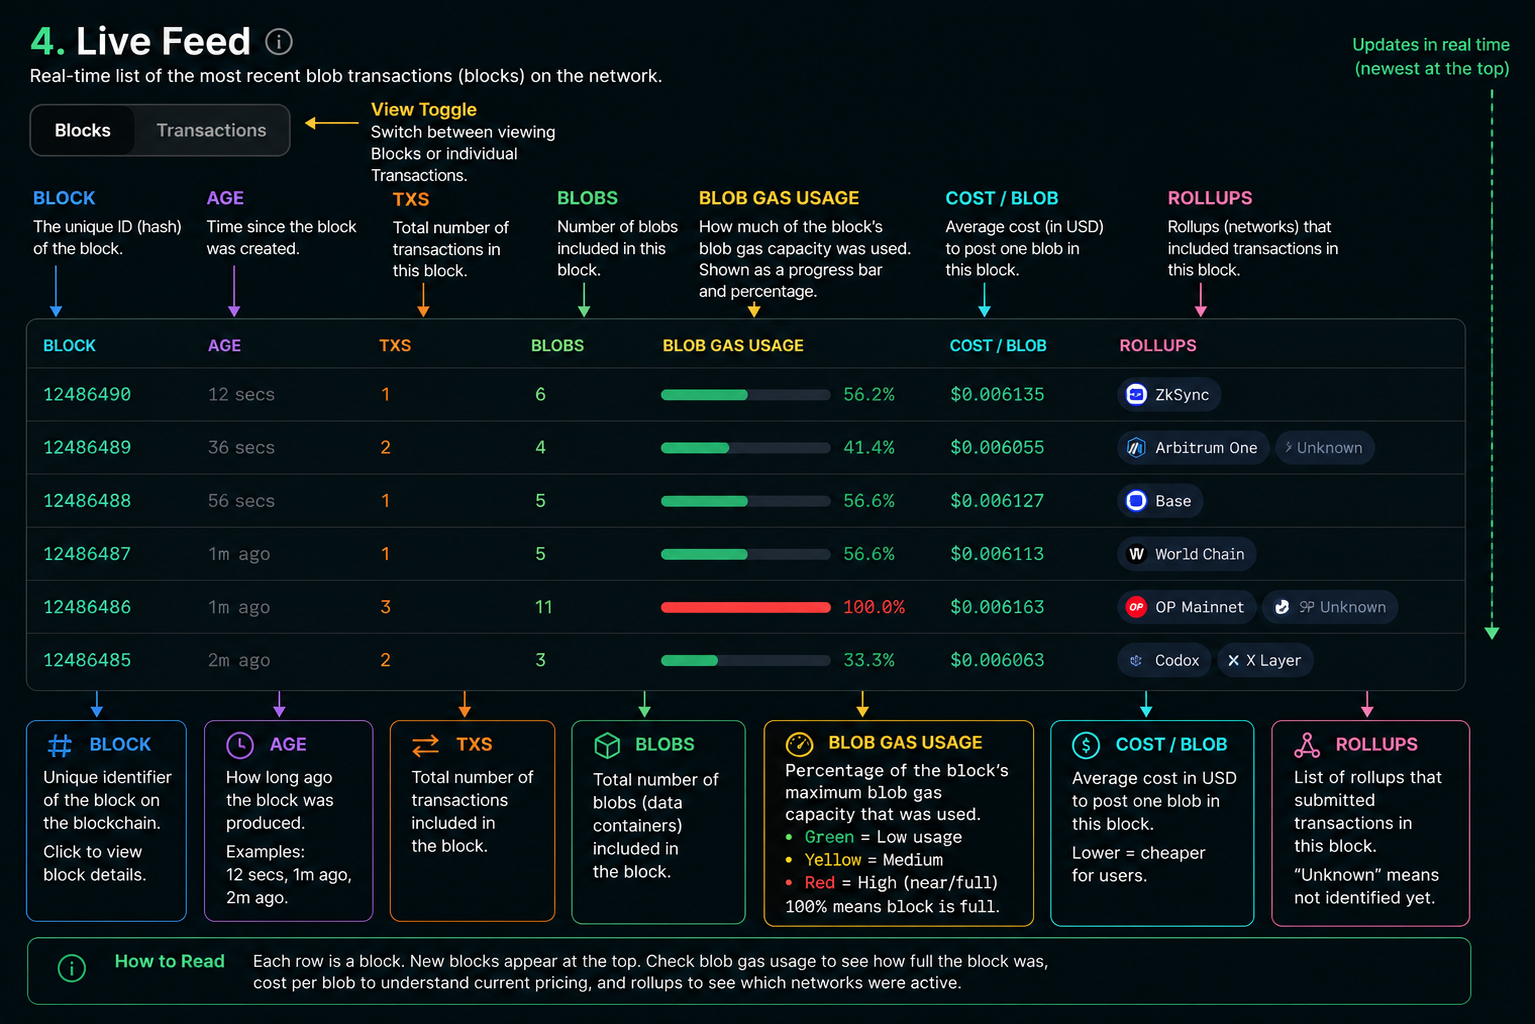
Live Feed
The Live Feed shows recent blocks and transactions that include blobs. Each row lists the block, age, number of transactions, number of blobs, gas usage for blobs, cost per blob, and related rollups. Use it to spot spikes in activity or sudden fee changes.
Tip: watch the "Cost / Blob" column to see how expensive storing data is over time. Combine this with the heatmap and charts to understand if costs are trending up or down.
Metrics & Charts
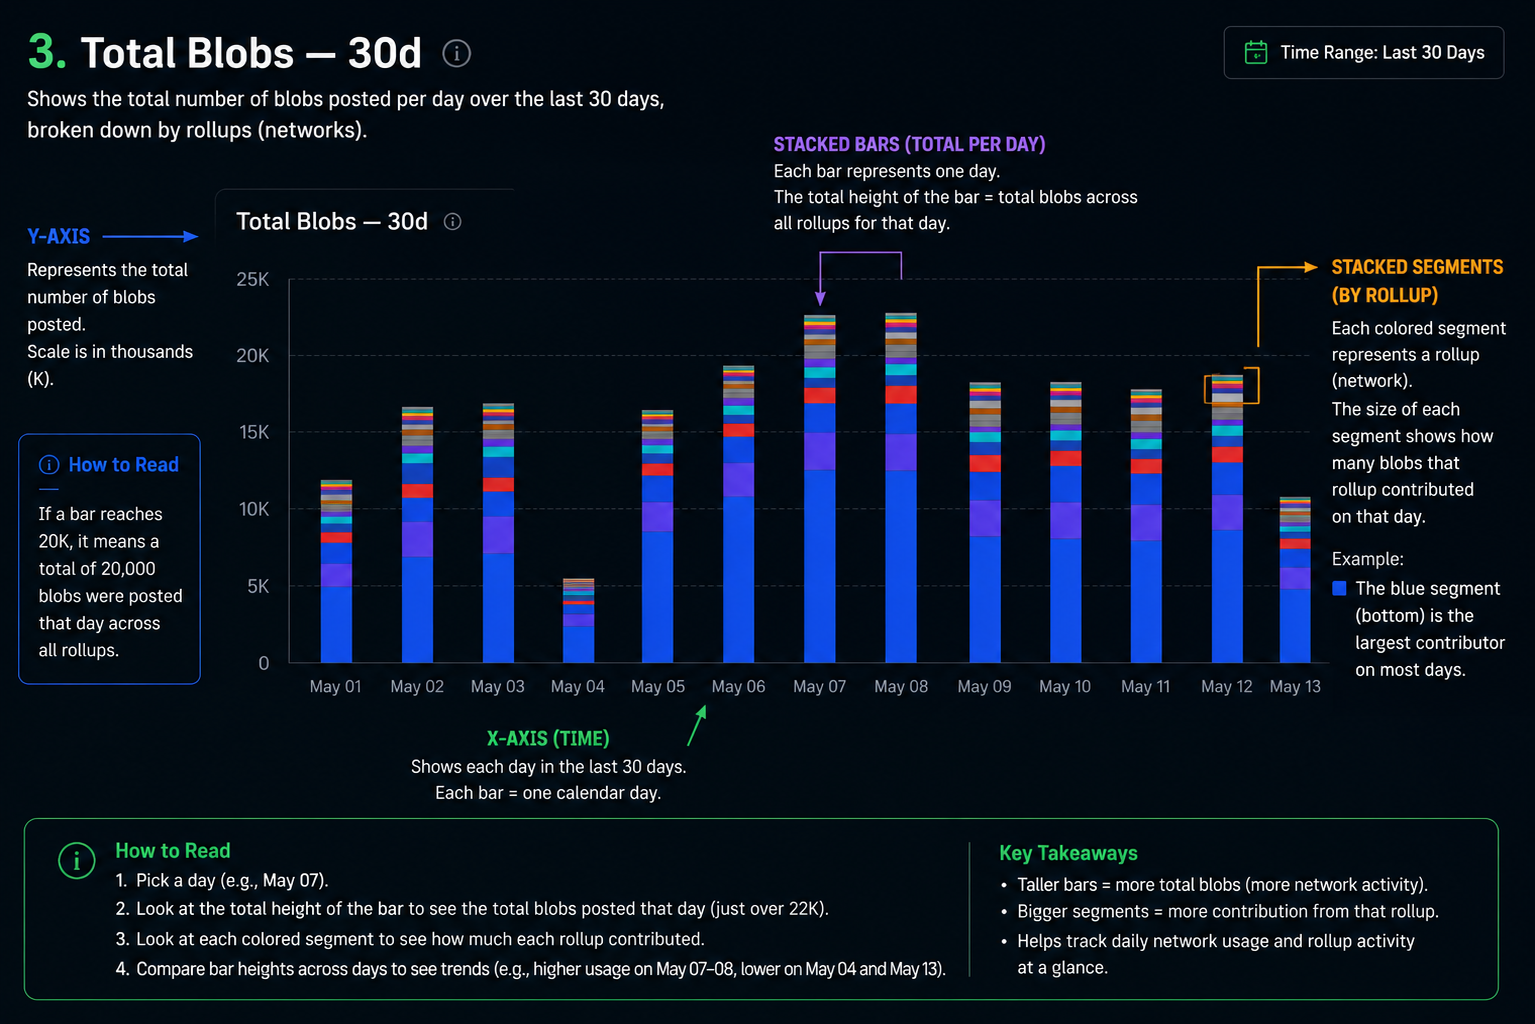
Key charts include total blobs over time, rollup share (who is producing blobs), and cost heatmaps. These visualizations help you answer questions like "Which rollups are using most blob space?" and "When are costs peaking during the day?".
Use the charts to compare daily trends, evaluate rollup market share, and detect anomalous behavior that may signal congestion or new usage patterns.
Total Blobs — 30d
Rollup Share
Cost Heatmap — 7d × 24h
How to Use This Page
- Start with the Live Feed to see recent blocks and immediate activity.
- Open the Leaderboard to identify top blob producers and active dApps.
- Use the Market view to inspect fee volatility and long-term trends.
- Check Research for deeper analysis and experimental insights.
- Toggle Light/Dark mode with the control in the header for best readability.
Leaderboard
Track the top 40 rollups by blob activity and contribution. Monitor real-time rankings, throughput, costs, and market share.
Top Rollups
| # | Rollup | Total Blobs | Avg Cost | 24h Trend | Market Share |
|---|---|---|---|---|---|
| 1 | Base | 7,845 | $0.003601 | +12.5% | 37.9% |
| 2 | World Chain | 2,286 | $0.003492 | +5.2% | 11.0% |
| 3 | Arbitrum One | 2,202 | $0.003382 | -2.1% | 10.6% |
| 4 | Optimism | 1,950 | $0.003421 | +8.3% | 9.4% |
| 5 | OP Mainnet | 1,080 | $0.003369 | +3.7% | 5.2% |
| 6 | Soleum | 750 | $0.003133 | -1.5% | 3.6% |
| 7 | Unichain | 654 | $0.003512 | +15.2% | 3.2% |
| 8 | Abstract | 441 | $0.003596 | +7.8% | 2.1% |
| 9 | Mantle | 420 | $0.003445 | -0.3% | 2.0% |
| 10 | Taiko | 385 | $0.003678 | +22.1% | 1.9% |
Showing top 10 of 40 tracked rollups. Scroll or visit the full leaderboard for complete rankings.
Undistributed Senders
Senders not yet categorized to a known rollup. These may be new protocols, custom implementations, or experimental services.
0x1234...5678
2 min agoBlobs
156
Avg Cost
$0.003421
0xabcd...ef00
5 min agoBlobs
134
Avg Cost
$0.003356
0x9999...0001
12 min agoBlobs
98
Avg Cost
$0.003512
0x7777...2222
18 min agoBlobs
87
Avg Cost
$0.003289
0x5555...4444
25 min agoBlobs
76
Avg Cost
$0.003678
0x3333...1111
32 min agoBlobs
64
Avg Cost
$0.003445
0xeeee...cccc
41 min agoBlobs
52
Avg Cost
$0.003721
0xaaaa...bbbb
55 min agoBlobs
48
Avg Cost
$0.003189
0xffff...0000
1h agoBlobs
41
Avg Cost
$0.003534
0x1111...6666
1h 15m agoBlobs
35
Avg Cost
$0.003412
Market
Real-time market signals, fee trends, and blob demand metrics. Monitor volatility, utilization patterns, and network dynamics to inform operational decisions.
Fee Trends
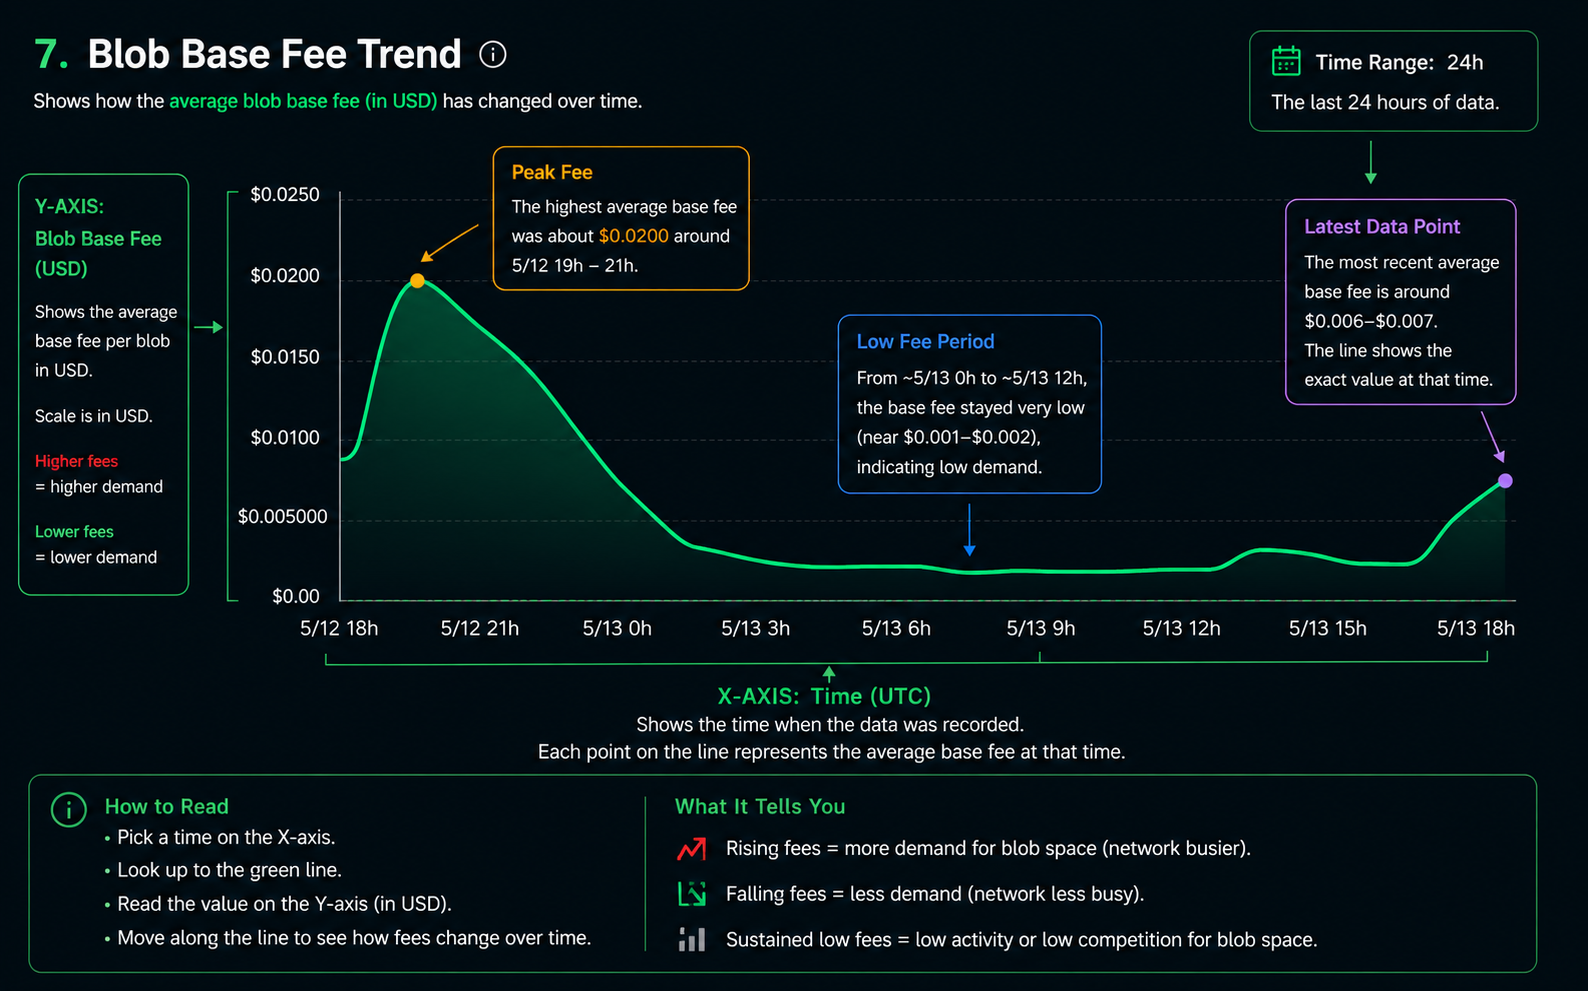
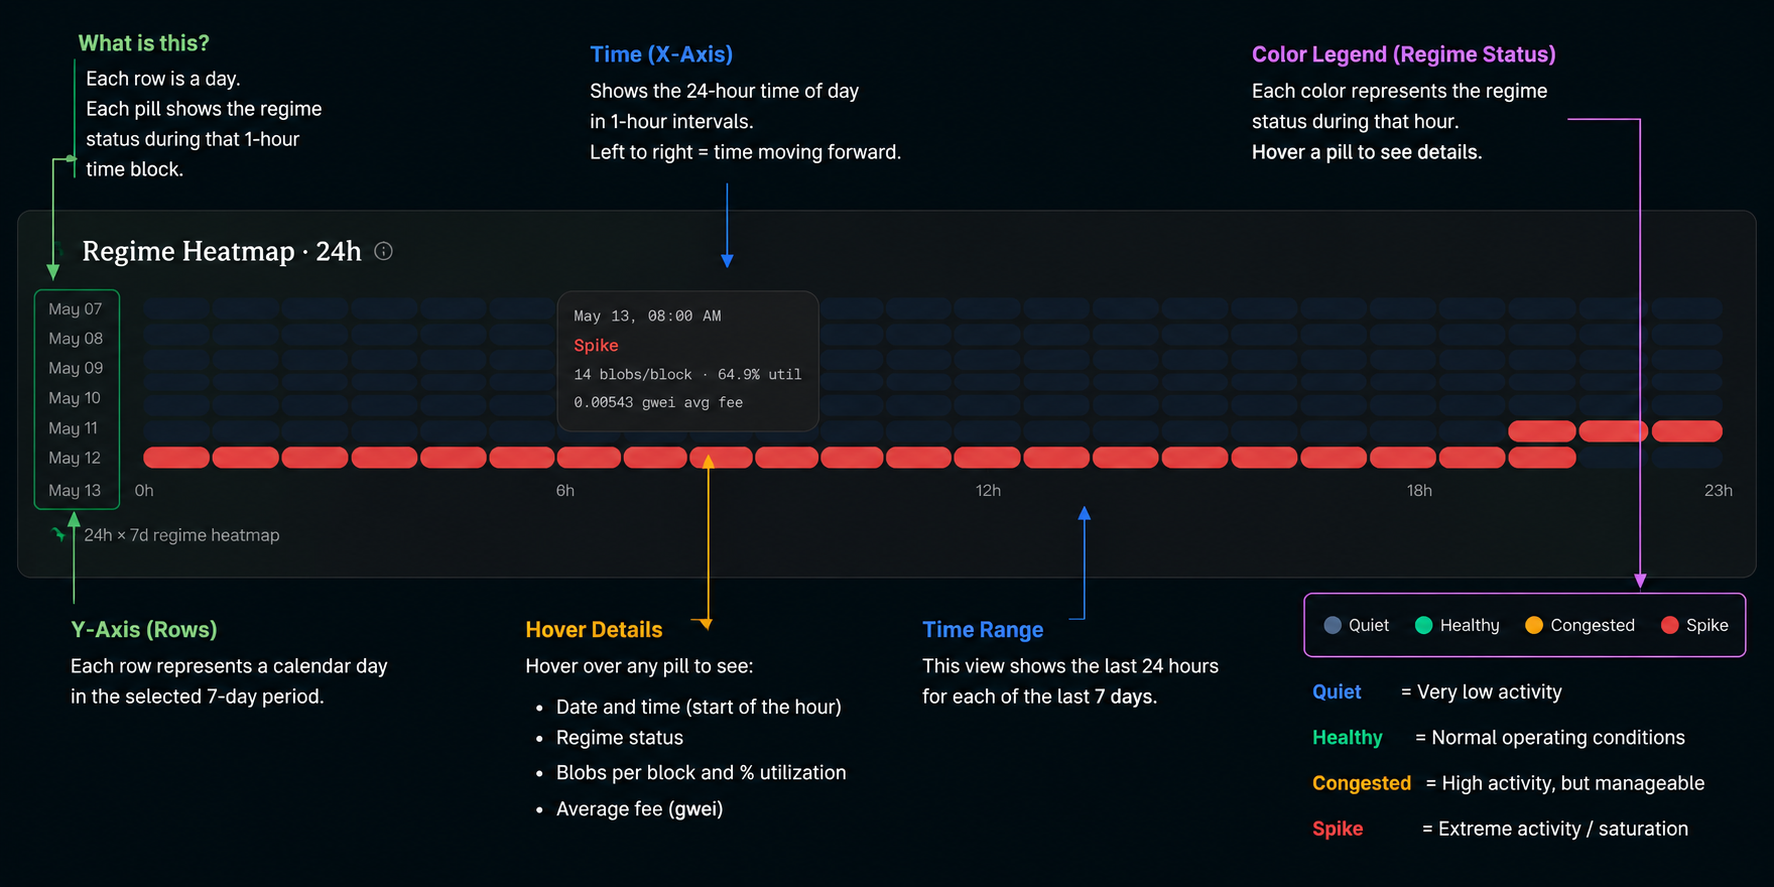
Monitor fee patterns and pricing cycles to understand when it's best to submit blob transactions. The trend chart shows historical fee movements over the past week, while the heatmap reveals peak cost periods across different times of day and day of week.
Blob Base Fee Trend
Regime Heatmap — 7d × 24h
Network Activity
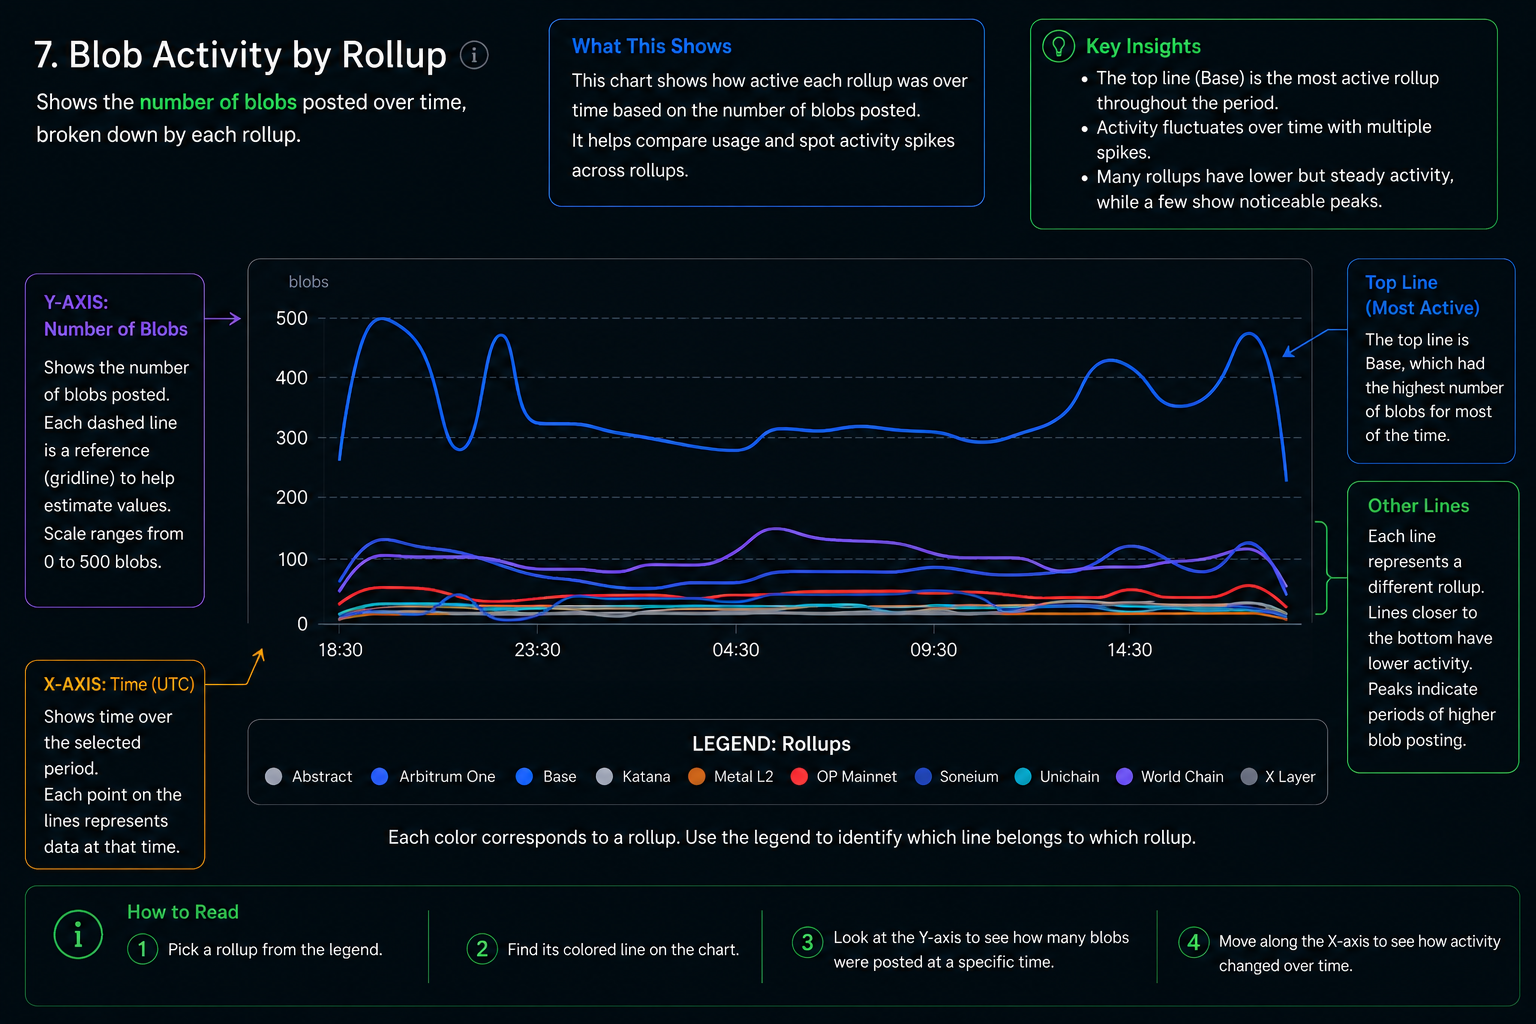
See which rollups are actively submitting blobs and understand their contribution to overall network activity. This helps identify dominant players in the blob ecosystem and track shifting usage patterns.
Blob Activity by Rollup (24h)
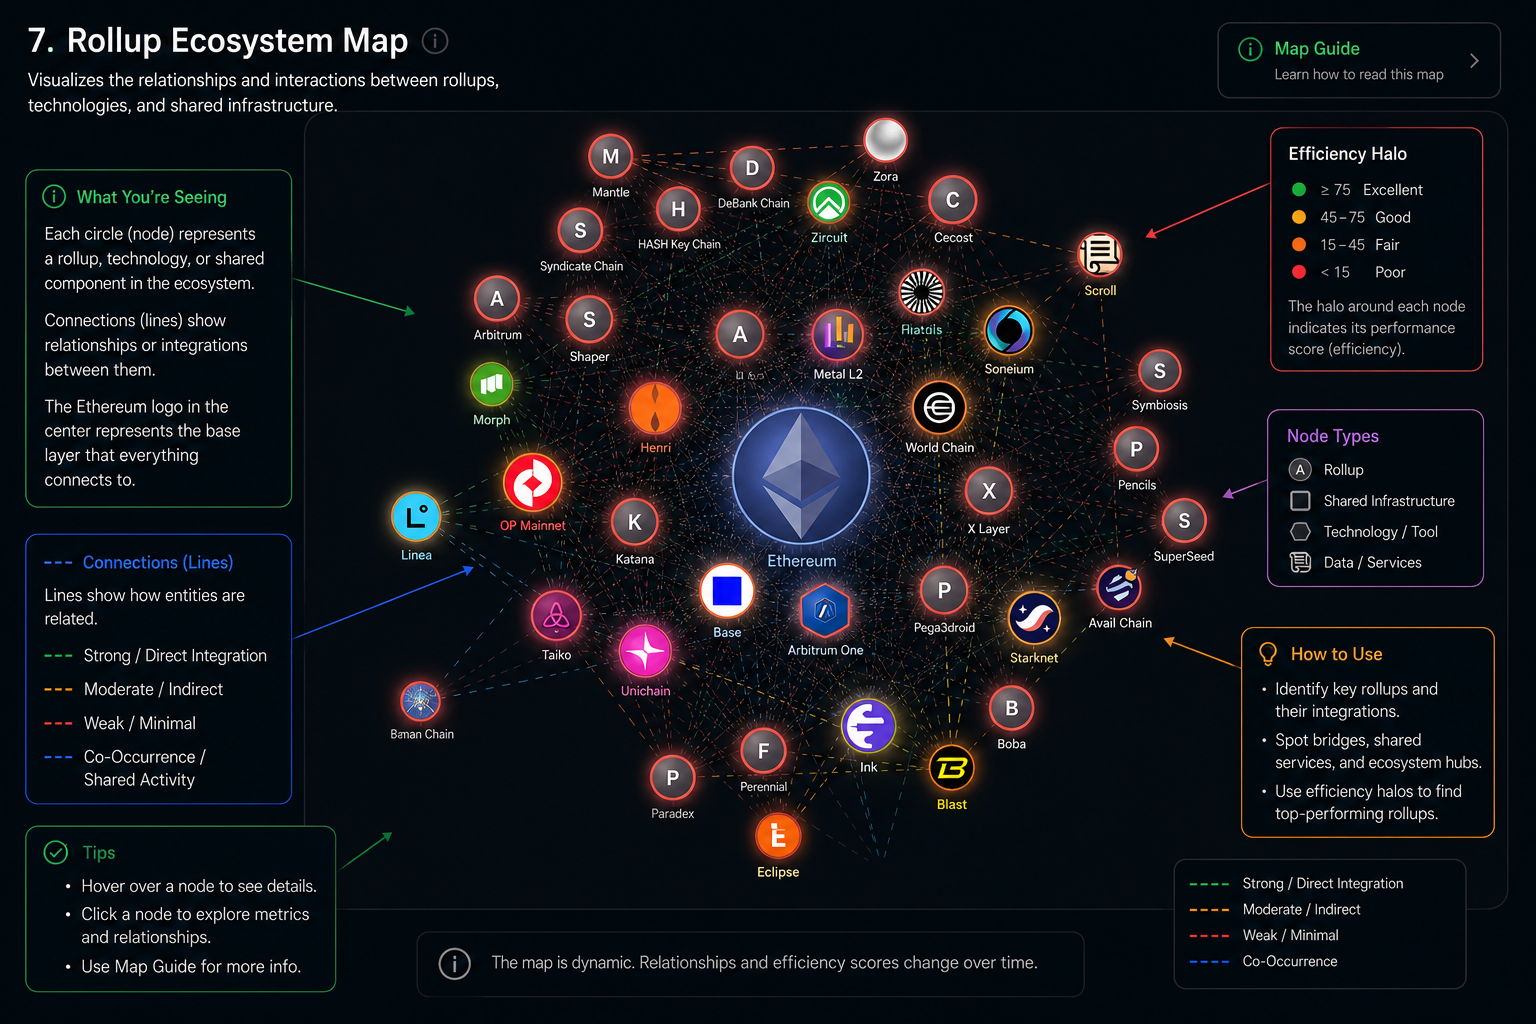
Rollup Ecosystem Map
Visualize the complete rollup ecosystem and understand the relationships between different rollup solutions, their market share, and their blob utilization patterns. This comprehensive map provides a high-level view of the blob landscape.
Research
Long-horizon blob economics: how usage grows, how different rollups behave over time, and what the market signals are telling us. This section is meant to be readable for non-technical users while still giving enough depth for analysis.
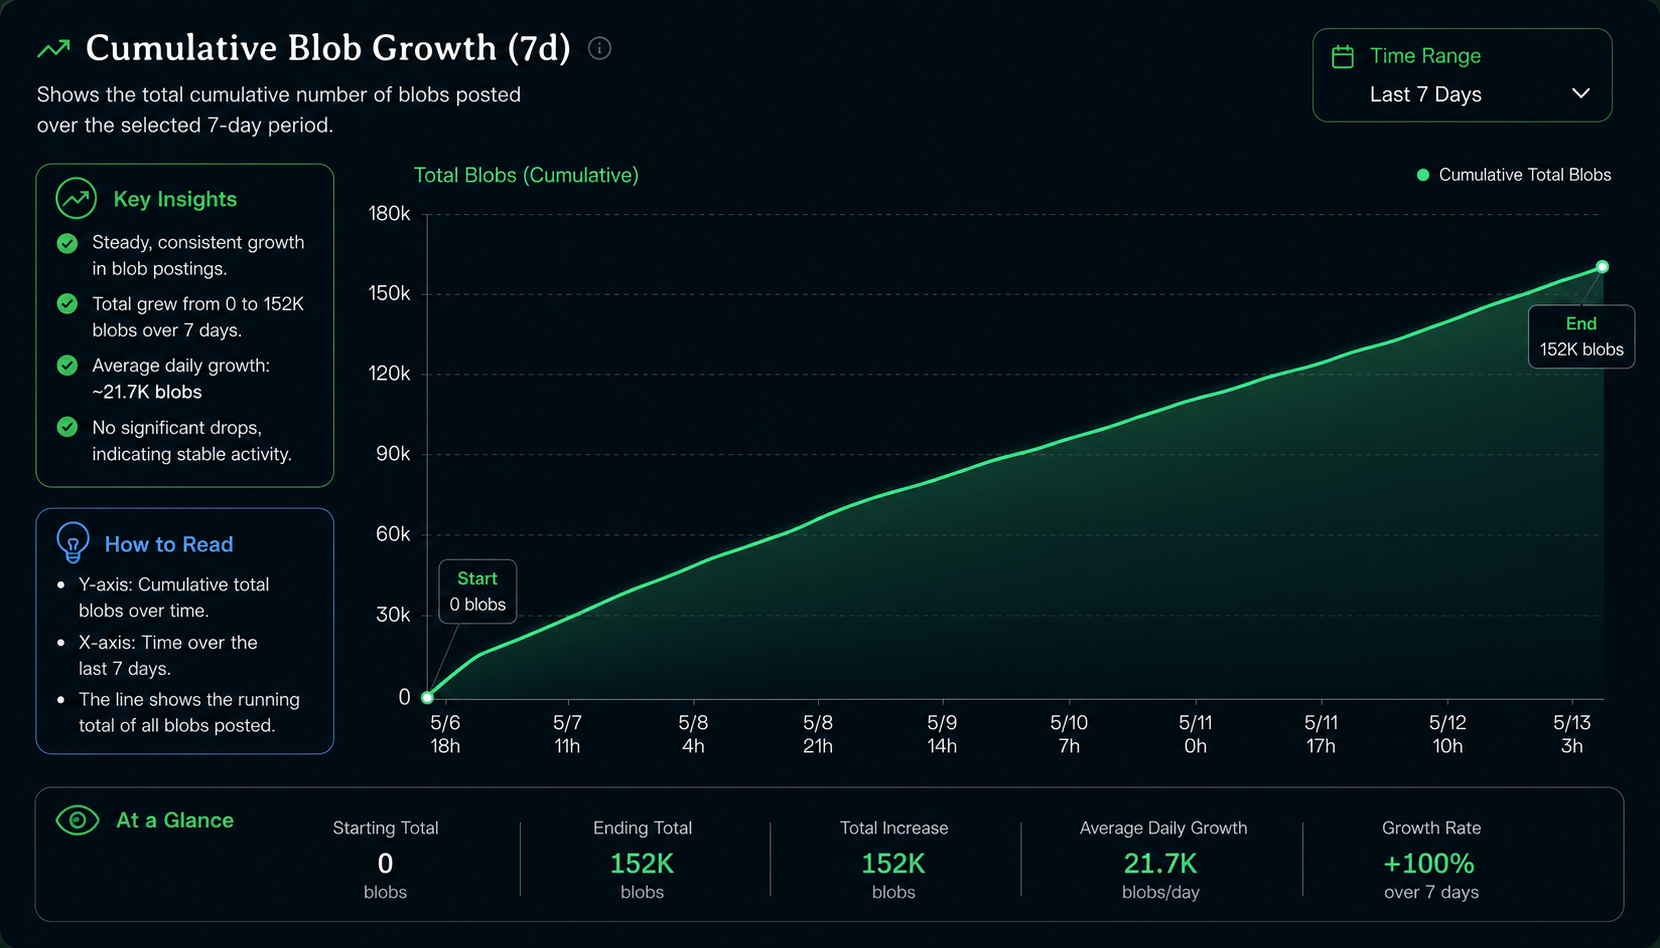
Cumulative Blob Growth
The line chart below shows how blob usage rises over time. A steady slope means adoption is expanding smoothly; sharp jumps often indicate release cycles, new rollup launches, or changes in fee incentives.
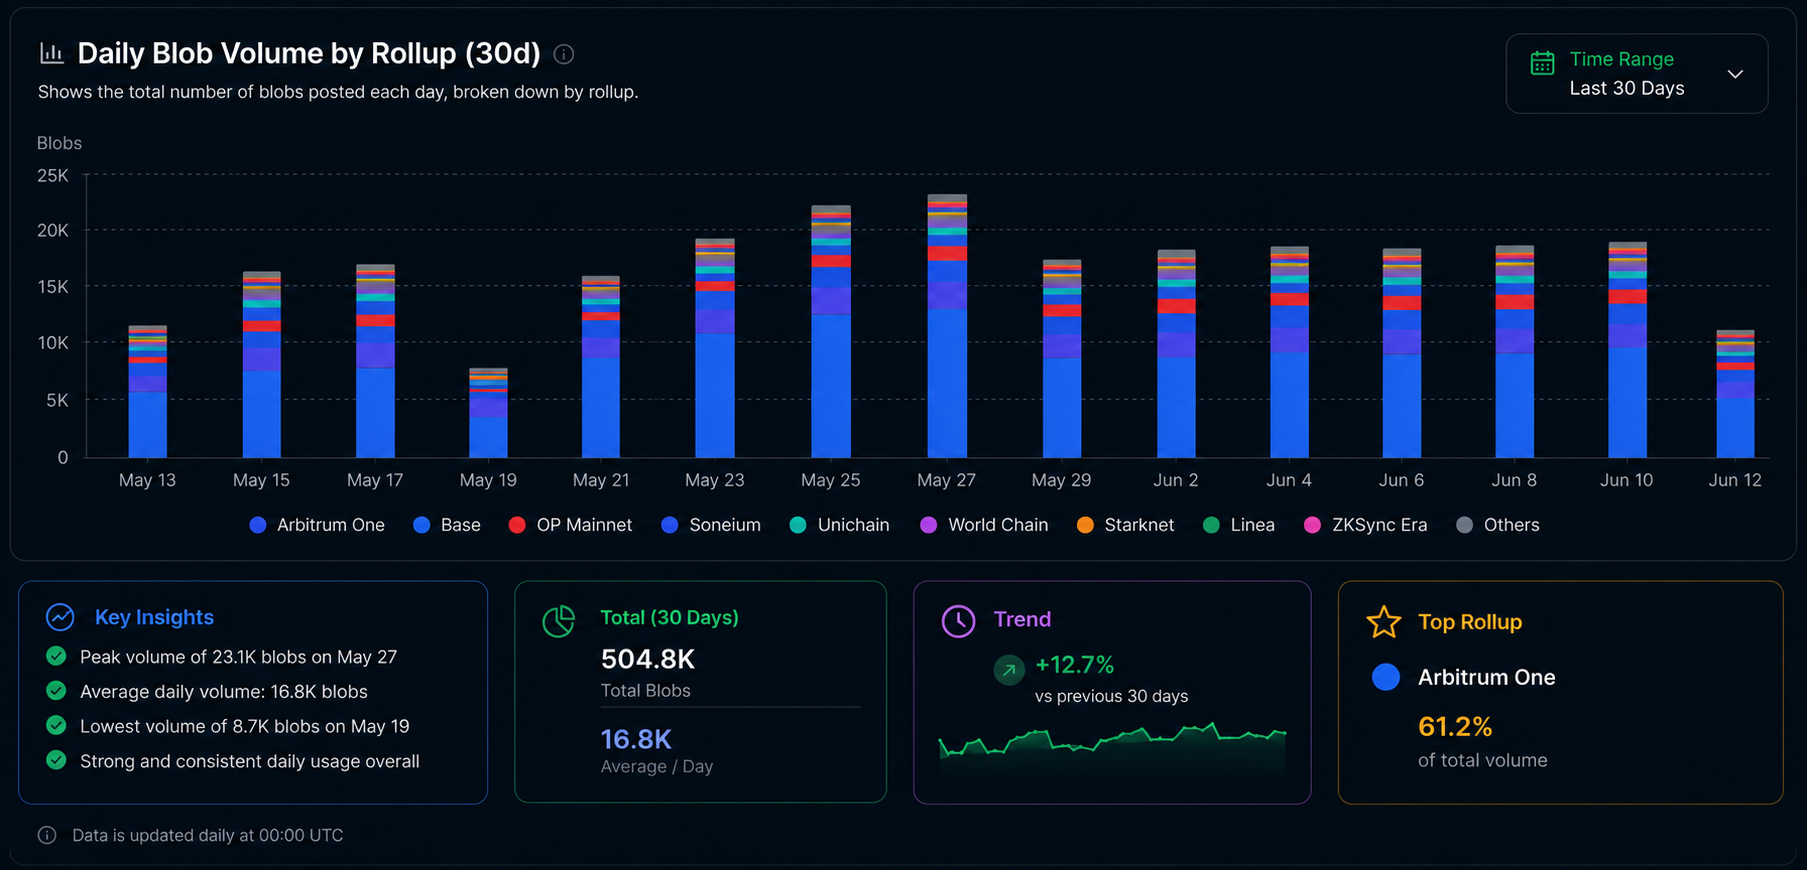
Daily Blob Volume by Rollup
This chart breaks down total blob volume by rollup across the last 30 days. It helps answer a simple question: which rollups are consistently active, and which ones spike only occasionally?
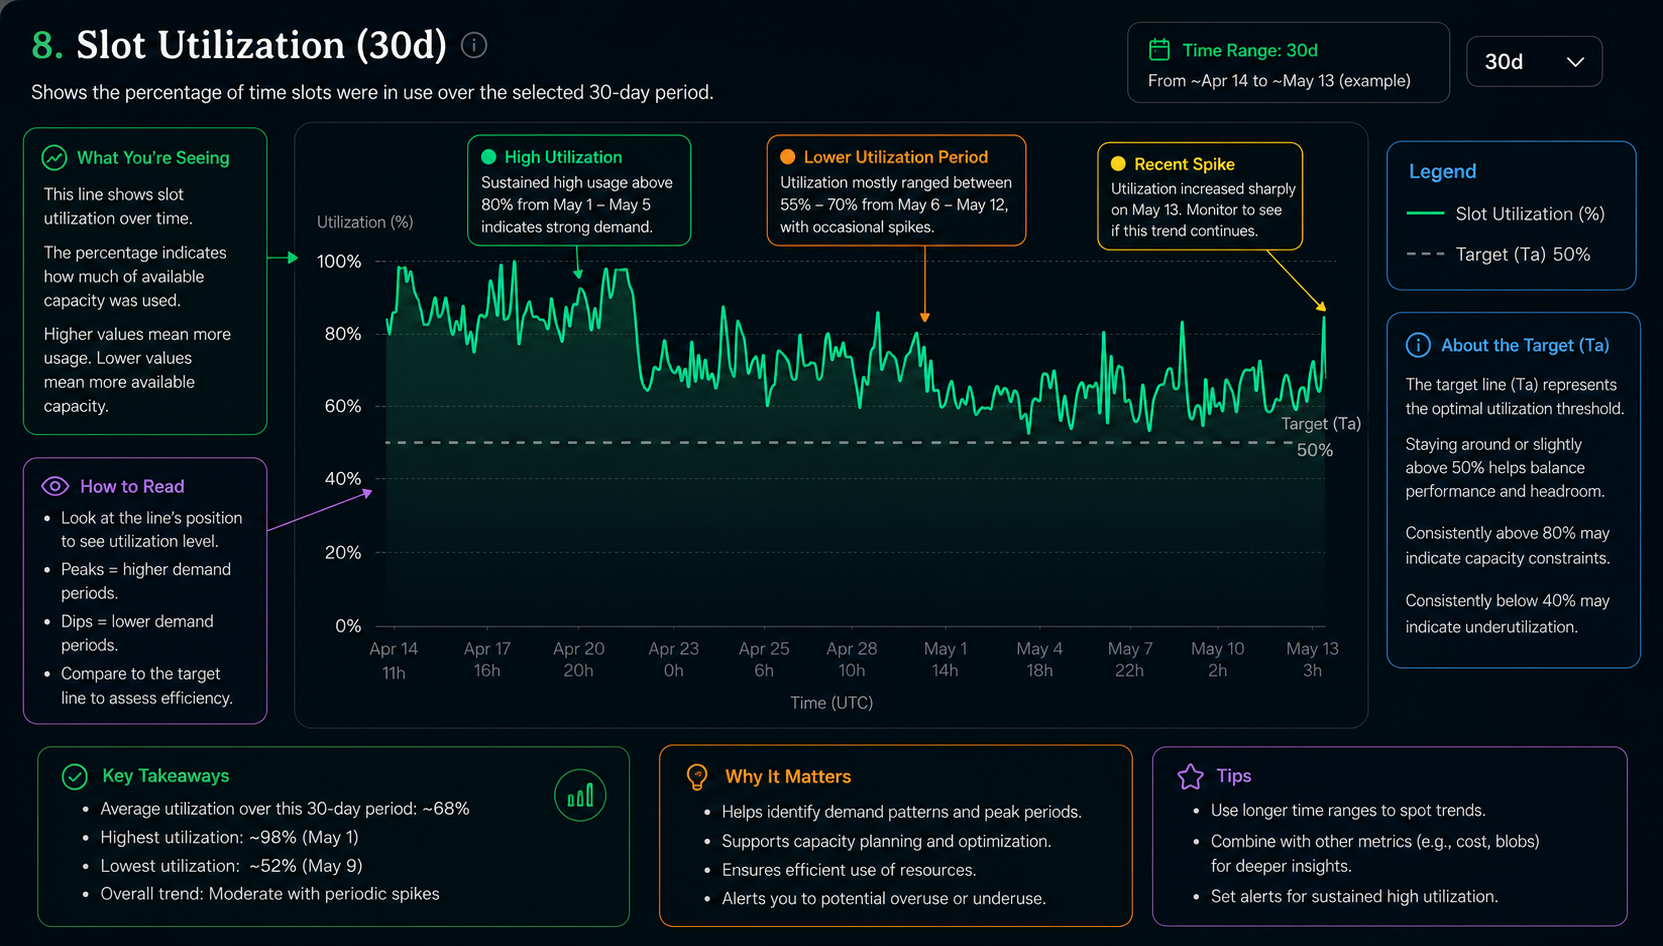
Blob Slot Utilization
Slot utilization shows how full the blob space is over time. When utilization is high, it indicates strong demand and potentially higher fees. When it drops, it suggests less network congestion or decreased interest in blob transactions.
What the Research Means
A simple way to read this section: growth chart = usage growth, donut chart = who is dominating, stacked bars = when blobs were created, and regime timeline = how stable the market has been.
What to Watch Next
Watch for sudden growth spikes, a shift in market share, or a wider distribution across rollups. Those often mean the ecosystem is changing.